This is part 1 of a 3 post series:
- Part 2: Raspberry Pi config
- Part 3: Arduino config
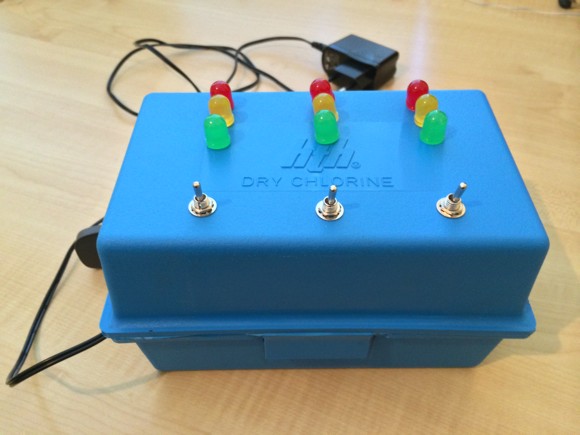
I recently attended a 4 week Arduino course, and for the final project built a physical status indicator for our servers. Besides using an Arduino to show and control the display, it retrieved and processed all of the data with a Raspberry Pi. It is a fairly messy collection of applications, scripts and services, and so I called it the FrankenStatus.
It uses:
- an Arduino Uno R3
- 9 12mm LED’s (3 red, 3 yellow, 3 green)
- 3 switches
- 6 resistors
- a mess of wire
- a Raspberry Pi
- a USB Wifi dongle
- a ruby script to collect the data
- the New Relic API
- the Google Analytics Realtime API
- a Sinatra web app
- Monit (to keep all the services running)
- ngrok to create a tunnel through to the web app
- pushover.net to notify me of the local IP address when the Raspberry Pi boots
So, how does it work. The meat of it is a ruby script that polls both New Relic and Google Analytics every 2 minutes. We have 3 applications on New Relic, each of which has a number of servers connected to it. For each application I receive an overall health indicator, an Apdex score and a list of the physical servers currently in that application pool. For each of the servers I then get their current CPU and RAM usage. For each of the applications, I then use the Google Analytics Realtime API to see how many concurrent users are on the server.
For each application, I then calculate the average and max CPU across all servers, average and max RAM usage across all servers, convert the Apdex score into a % and then determine the maximum percentage vaue from all the measurements for that server. I then also invert the number of concurrent users on the site against a set maximum – the idea here is that the more users on the site, the lower the number. I’ll explain why a bit later.
All of this is then built into a comma separated string made up of the following for each of the applications:
- maximum value of all values for this application
- maximum RAM
- average RAM
- maximum CPU
- average CPU
- apdex as a percentage
- indicator of concurrent users
This then gets sent via the USB port as serial data to the Arduino.
On the Arduino, a Serial event listens for new data, and when it arrives, captures it, splits it appart and assigns it to data structures held in memory for each of the applications. The main processing loop on the Arduino simply turns LED’s on and off based on the data in the structures for each application. On the actual device are a red, yellow and green LED for each application, and by turning on either green, green + yellow, yellow, yellow + red or just red I can indicate values within 20% bands. So if only green is on the value is between 0 and 20%. if yellow and red are both on, the value is between 60 and 80%. In standard mode, each set of 3 LED’s represent one of the applications, and the LED combination that I flash is the maximum value across all values for that specific application. The number of concurrent users that I inverted (to get a lower number for more concurrent users) is then used as the number of milliseconds that the LED is on for. So the higher the number of people on the site, the lower the value I send the Arduino and the faster the LED(s) for that application flash. So at a glance I can tell if something is amiss with the application (by the combination of LED’s that are on) and what sort of load the application is under (by the speed of the flashing).
Each application also has a switch. When I turn on the switch for an application the 3 banks of LED’s change from giving me an overview of each of the 3 application, to showing me specific detail for the application that I’ve just switched on. The 3 LED banks then show me RAM, CPU and Apdex, again split into 5 bands by percentage. For the CPU and RAM though the LED combinations flash alternately between showing me maximum CPU/RAM and average CPU/RAM.
As an example, if I see that the LED’s for application A are flashing red only and quite slowly, I know something is wrong. I flick the switch for application A and now the CPU bank flash green, the Apdex is green and the CPU flashes between yellow+green and red. That tells me that on one of the physical servers within the application pool, the CPU is above 80%, but on average they are still fine. Immediate visual feedback and some quite specific information on what to go check out.
In followup posts I’ll go into detail on the scripts to grab and process the data, the general Raspberry Pi setup with ngrok and pushover, and the physical build and code for the Arduino.