A while back I came across this post on the etsy Code as Craft blog and have been meaning to have a play with it ever since.
I decided to set it up using CentOS under VirtualBox for two main reasons. First, I try to keep my machine as clean as possible, so rather than install a whole load of additional libraries and services on my Mac, I can keep the environments separate. Having it living in a virtual machine also means I can start, shutdown or destroy the environment without it impacting my ability to carry on with my day job
The reason to go with CentOS is because they have a nice secure minimal installation that you can get up and running quickly. I prefer to start with a base and then build on top of that with just the stuff that I need, rather than install the kitchen sink and remove the stuff I won’t be using. The rest of this post is a (hopefully) step by step guide of how I got it up and running. I started with the CentOS-6.3-x86_64-minimal.iso CentOS disk image, so I’m going to assume that you have that downloaded and also have VirtualBox installed.
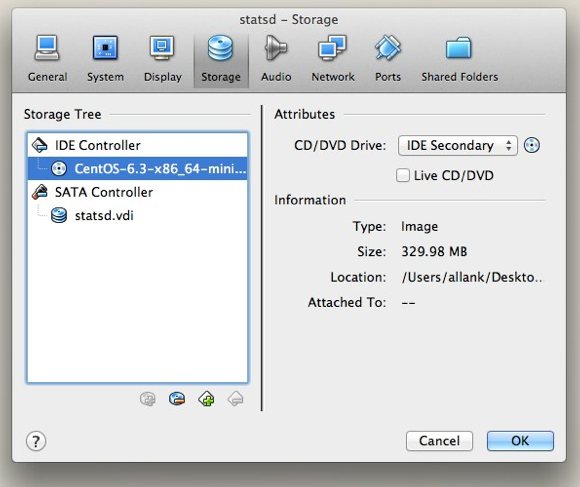
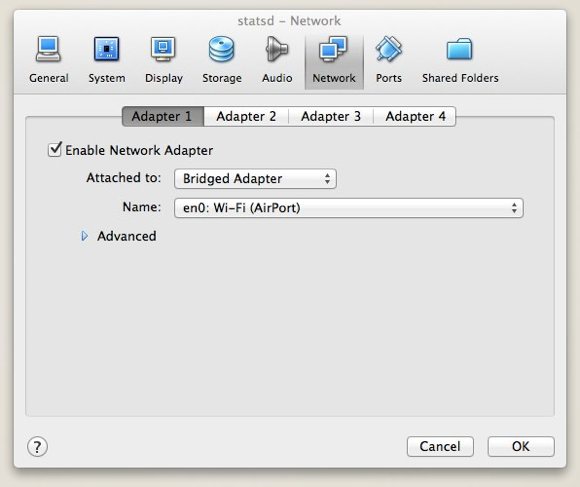
When creating the virtual machine you will need to attach the CentOS-6.3-x86_64-minimal.iso disk image to the CD device, and change the networking mode to bridged. It will default to NAT, which will put the virtual machine on a private network on your machine, making it invisible to other machines on the network. Using bridged mode will allow it to DHCP an IP from your networks DHCP server or router.
After the installation is complete you can log in as root and enable the ethernet bridge. To do this, you need to edit the /etc/sysconfig/network-scripts/ifcfg-eth0 file:
vi /etc/sysconfig/network-scripts/ifcfg-eth0
modify the line that reads
ONBOOT="no"
to be
ONBOOT="yes"
(If you’ve never used vi, have a quick read of this) You can now restart the box to bring up the network interface and get it to DHCP an IP:
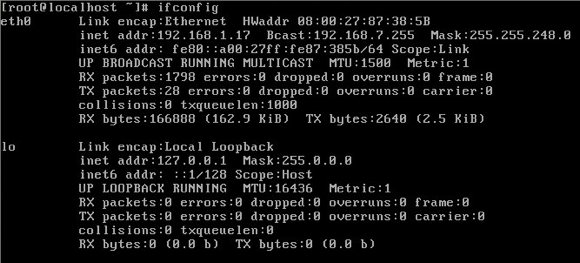
Your ifconfig output should now include the newly configured eth0:
I then add a non-privileged user so that I’m not always logged in as root:
useradd -m allank
passwd allank
and then install sudo
yum install sudo
After the sudo install has completed, add your non-privileged user to the /etc/sudoers file:
vi /etc/sudoers
add the line (with your username instead of mine)
allank ALL=(ALL) ALL
save the file – the file is read-only, you will need to save with :w! – and log out as root and back in as your non-privileged user.
Now we can start installing some tools we’ll use during the build:
sudo yum install wget perl make gcc git
Once that is done you can go ahead and install node.js and it’s package manager:
wget http://nodejs.tchol.org/repocfg/el/nodejs-stable-release.noarch.rpm
sudo yum localinstall --nogpgcheck nodejs-stable-release.noarch.rpm
sudo yum install nodejs-compat-symlinks npm
Once that is done you can test the node installation by creating their example hello world application:
vi example.js
add this code from the node.js site, substituting your virtual machines IP address for 127.0.0.1:
var http = require('http');
http.createServer(function (req, res) {
res.writeHead(200, {'Content-Type': 'text/plain'});
res.end('Hello Worldn');
}).listen(1337, '192.168.1.17');
console.log('Server running at http://192.168.1.17:1337/');
Before you fire up the example, you need to open up some ports. CentOS by default only allows incoming connections on port 22 (to allow remote SSH access) – to allow incoming connections on port 1337 (the port that the node.js example code listens on) you need to add the rule into iptables:
sudo /sbin/iptables -I INPUT -p tcp -m tcp --dport 1337 -j ACCEPT
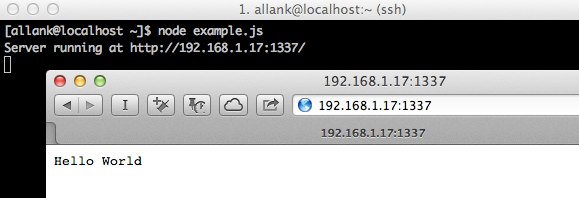
You can now start the node.js example
node example.js
and test it by browsing to your virtual machines IP on port 1337:
Now we can grab the statsd project from github:
git clone https://github.com/etsy/statsd.git
switch to the statsd directory and create a simple config file:
vi statsdconf.js
and add the following:
{
debug: true
, port: 8125
}
we then need to add port 8125 to the allowed incoming ports for iptables so that we can send data to the statsd server from external sources:
sudo /sbin/iptables -I INPUT -p udp -m udp --dport 8125 -j ACCEPT
notice that this time we are allowing UDP traffic in on the listening port, as this is what the statsd server listens for. We’ll also want to save this rule so that it’s still there after we reboot:
sudo /sbin/service iptables save
sudo /sbin/service iptables restart
and the then we can start up statsd:
node stats.js statsdconf.js
To test it we can either run one of the supplied clients, or just write up a simple python script. I want to make sure that the data is being received from a remote host (and that our iptables rule is allowing the data through) so I created this script on the host machine:
vi stats_test.py
add this code:
import socket
sock = socket.socket( socket.AF_INET,
socket.SOCK_DGRAM )
sock.sendto("ping:1|c", ("192.168.1.17", 8125))
With the statsd server running, run the python script:
python stats_test.py
You should see the ping arrive in the console log of the statsd server:
4 Aug 08:31:29 - debugCounters:
{ 'statsd.packets_received': 1,
'statsd.bad_lines_seen': 0,
ping: 1 }
Timers:
{ 'statsd.packet_process_time': [] }
Gauges:
{}
So now that statsd is up and running, we need to install Graphite so that we can actually see the data we’re collecting in a nice visual way. Graphite runs on top of Django, and needs a bunch of libraries to build the graphs. You could run Graphite using the Django development server, but I prefer to run it under apache:
sudo yum install pycairo mod_wsgi python-memcached
To install Django easily, first install EPEL:
sudo rpm -ivh http://mirror.us.leaseweb.net/epel/6/x86_64/epel-release-6-7.noarch.rpm
then install Django and required libraries:
sudo yum install Django bitmap bitmap-fonts python-pip django-tagging python-devel
Now all the requirements for Graphite are in place, we can install the component parts (and their dependencies) using pip:
sudo pip-python install carbon
sudo pip-python install whisper
sudo pip-python install graphite-web
At this point all of the component bits are in place and just need to be configured and started. Switch to the graphite conf directory
cd /opt/graphite/conf
and copy the necessary example conf files:
sudo cp carbon.conf.example carbon.conf
sudo cp storage-schemas.conf.example storage-schemas.conf
sudo cp graphite.wsgi.example graphite.wsgi
You now need to create an apache vhost configuration for graphite. There’s a great example one here that needs minimal editing.
sudo vi graphite.conf
Add the code from the above link, and edit the line:
Alias /media/ "@DJANGO_ROOT@/contrib/admin/media/"
to be
Alias /media/ "/usr/lib/python2.6/site-packages/django/contrib/admin/media/"
Now add the graphite.conf file to the apache conf.d directory so that it loads with apache:
sudo ln -s /opt/graphite/conf/graphite.conf /etc/httpd/conf.d/graphite.conf
Switch to the graphite webapp directory and create the settings file:
cd /opt/graphite/webapp/graphite
cp local_settings.py.example local_settings.py
And then create the database:
python manage.py syncdb
You can now start the carbon cache:
cd /opt/graphite/
./bin/carbon-cache.py start
Before we start apache, we need to allow connections on port 80:
sudo /sbin/iptables -I INPUT -p tcp -m tcp --dport 80 -j ACCEPT
sudo /sbin/service iptables save
sudo /sbin/service iptables restart
And then disable selinux (this is the access control service in CentOS that restricts access to files)
sudo vi /etc/sysconfig/selinux
change the line
SELINUX=enforcing
to
SELINUX=disabled
Then give the apache user ownership of where it will keep it’s log files:
chown -R apache:apache /opt/graphite/storage/
and then start apache:
sudo /sbin/service httpd start
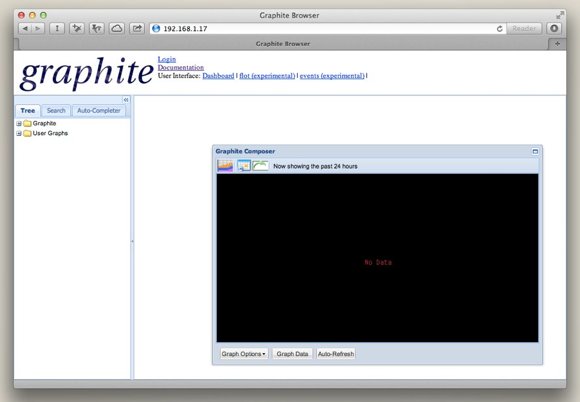
You should then be able to view the Graphite front-end by visiting your virtual machine’s IP in a web browser:
The last step is to connect statsd to send it’s data to Graphite:
sudo vi statsdconf.js
add the Graphite options to the config file:
{
graphitePort: 2003
, graphiteHost: "127.0.0.1"
, debug: true
, port: 8125
}
Start node again:
node stats.js statsdconf.js
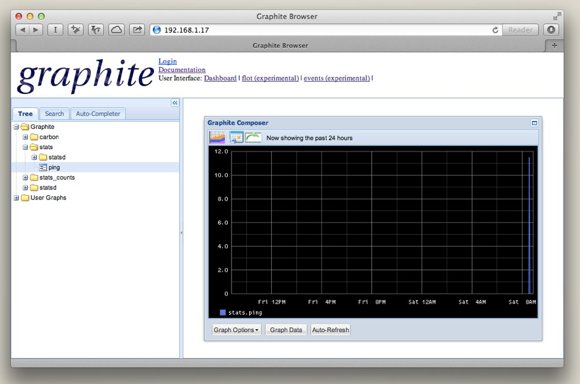
Now, if you send data to the statsd server, it will appear in the tree view on the left – select the stats you want to view the graph:
This is the process that works for me – please let me know if I’ve ignored or glossed over some crucial steps.