This is part 2 of a 3 post series:
- Part 1: FrankenStatus Overview
- Part 3: Arduino config
So the FrankenStatus is made up of 2 main bits – the electronic/Arduino bits (that I’ll write about in the next post) and the Raspberry Pi. There’s a couple of things on the Pi to make it all come together, most of which are entirely optional but made my life easier.
- pushover.net to notify me of the Pi’s DHCP’d IP address
- ngrok.com to expose the web server to the internet
- nginx and sinatra to run a simple web server
- a ruby script to collect and process the server stats
Notifications with Pushover.net
One of the issues that I ran into previously with the Raspberry Pi was that without a screen attached to it (as is the case with the FrankenStatus), I don’t know the IP address that it has DHCP’d. Last time I solved it by simply hard coding the IP address, but this time I decided to make it a bit more dynamic. I use the excellent Pushover Notifications App for sending myself custom notifications and since they have a simple REST API, it was quick and easy to work out the IP address and send it directly to my phone.
Once you have the Pushover app and are registered on their site, you will need to log in and create an application.
I also added an icon for it to differentiate from the other messages I receive. When you create an application you will get an API auth token to use when sending your messages.
sleep 30
curl -X POST -d "token=putyourpushoverauthtokenhere&message=$(ifconfig wlan0 | grep 'inet' | cut -d ':' -f2 | cut -d' ' -f1)"  "https://api.pushover.net/1/messages.json"
The sleep function is a hack to make the script wait until the networking has initialised properly. There’s a neater way to grab the IP address (see later), but this worked at the time.
I run the script in the background from my /etc/rc.local like this:
nohup /usr/local/bin/pushover &
When that runs you get a nice notification to your phone or iPad:

Exposing the Pi to the outside world with ngrok
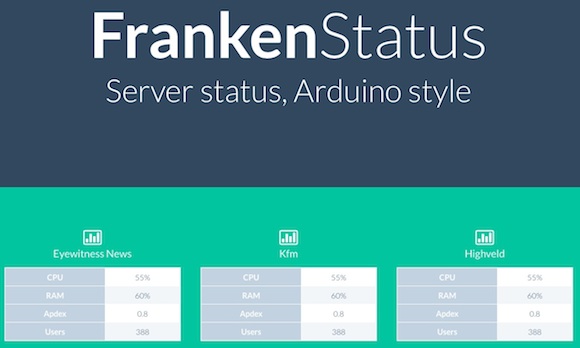
The FrankenStatus shows me status at a high level, and so I decided to set up a simple web server so that I could get the latest exact status values. Even though I had the local IP address of the Raspberry Pi, I might not always be on the same network, so decided to make the web server available outside of the local network. To do this I turned to ngrok – “secure introspectable tunnels to localhost”. If you do any kind of web development on your local machine and want to be able to show people without deploying it to an internet accessible server, ngrok is the way to go. Basically it exposes the port you specify on your local machine as a dynamically generated hostname on ngrok.com. However if you register on the site (and pay a small fee – $2 a month), you can choose and reserve your own host name.
Once you’ve registered you’ll be able to grab an auth token for ngrok. With that in hand, create a /etc/ngrok file for your config settings:
auth_token: yourngrokauthtoken

tunnels:
  arduino:
    subdomain: "allank-arduino"
    proto:
      http: 80
Under the tunnels section I created a named tunnel called arduino and specified the subdomain I wanted to use. I used something fairly specific that I knew would probably always be available, but if you want to be safe, just go pay the $25 for a year – it’s worth it. You also need to specify the protocol that will be proxies through and the port to listen to on the local machine. Since it’s a web server, http and port 80.
For the Raspberry Pi a Linux/Arm executable is available on the ngrok page, just click through to More platforms on the Download page.
I made sure that this was always available by using monit to check that the ngrok process was always running. Once monit is installed, you’ll need to make some changes to your /etc/monit/monitrc file. First delay the checking:
set daemon 120
with start delay 30
then create a check for ngrok. Because ngrok doesn’t create a PID file you’ll need to look for it by name:
check process ngrok matching "/usr/local/bin/ngrok -config /etc/ngrok start arduino"
start program = "/usr/bin/screen -d -m /usr/local/bin/ngrok -config /etc/ngrok start arduino"
stop program = "/usr/bin/killall ngrok"
the check process matching lets you use the command name to search the process list – be sure to use the full command with all arguments when matching otherwise it won’t find it. Because ngrok generates a lot of useful information, and doesn’t normally run in the background, I’m launching it with screen so that I can attach to the process if I need to debug anything. You then tell ngrok what config file to use (the one we created earlier) and which named tunnel to start.
Once that’s kicked off (around the same time as I get notification of the local IP address), I can access the Raspberry Pi’s web server on http://allank-arduino.ngrok.com
Running a web server
This was pretty simple – nginx with an upstream Sinatra application. Once nginx is installed, point it to the upstream server in the /etc/nginx/sites-available/default conf file:
upstream franken_server {
  server localhost:4567 fail_timeout=0;
}
then proxy all requests through to the upstream server:
server {
  root /usr/share/nginx/www;
  server_name _;
  try_files $uri @franken;
  location @franken {
    proxy_set_header X-Forwarded-For $proxy_add_x_forwarded_for;
    proxy_set_header Host $http_host;
    proxy_redirect off;
    proxy_pass http://franken_server;
  }
}
The upstream Sinatra application was also really simple:
require 'rubygems'
require 'sinatra'
require 'sqlite3'

configure do
  db = SQLite3::Database.new "/home/pi/FrankenStatus/updater/updater.db"
  db.results_as_hash = true
  set :db, db
end

get '/' do
  row = settings.db.get_first_row "select data, updated from data order by updated desc limit 1"
  ip = `hostname -I`
  erb :index, :locals => {:data => row["data"], :updated => row["updated"], :ip => ip}
end
All I needed to do was grab the most recent results that the update script had received (as you’ll see later, I store those in the raw format that I use to send to the Arduino), grab the IP address (by this time I had come to my senses and was using hostname -I to get the IP address) and then pass them through to a template file. The template simply showed the specific value for each of the servers, using the tuktuk CSS framework.
This too was then started up in the /etc/rc.local:
nohup /usr/bin/ruby /home/pi/FrankenStatus/server/frankenserver.rb &
Grabbing the data I needed
The most important script running on the Pi is the one that connects to our monitoring services and retrieves the stats that we want to display. The script (that we’ll go through a bit later) is called grabStatus.rb and is also started up from rc.local when the Pi boots:
nohup /usr/bin/ruby /home/pi/FrankenStatus/updater/grabStatus.rb &
It’s probably a good idea to also load this and the Sinatra web server up with Monit to make sure that they continue running, but for the time being this worked fine.
So on to the actual script. In an attempt to make the grabStatus script as portable as possible, I pulled all of my specific settings into an external settings.yml file:
serial_port: /dev/ttyACM0
new_relic:
  api_url: https://api.newrelic.com
  api_key: your_new_relic_api_key_goes_here
  ewn_app: new_relic_app_id
  mus_app: new_relic_app_id
You would obviously need to replace the placeholders in the settings file with your New Relic API key and the specific application ID’s of the apps within New Relic that you wanted to track.
The grabStatus.rb script is quite long, I’ll go through it in pieces and hopefully explain it with some level of clarity:
require 'json'
require "serialport"
require 'yaml'
require 'faraday'
require "sqlite3"
require 'google/api_client'
The New Relic API returns JSON, so we need to be able to interpret that and Faraday is a decent gem for making HTTP REST request. YAML is needed to parse the settings file we created earlier and serialport is used to send data to the Arduino through the USB port. I’m using a simple SQLite database to keep a log of the data we get back and using the Google API Client.
settings = YAML.load_file('/home/pi/FrankenStatus/updater/settings.yml')
Load the contents of the settings.yml file and store in the settings variable.
NR_API = Faraday.new(:url => settings['new_relic']['api_url']) do |faraday|
  faraday.request  :url_encoded             # form-encode POST params
  faraday.adapter  Faraday.default_adapter  # make requests with Net::HTTP
end
Create a new Faraday client pointing to the api_url we defined for New Relic in the settings file. We can then set up the Google Analytics client:
api_client = Google::APIClient.new(:application_name => 'Arduino', :application_version => '1.0')
path_to_key_file ="/home/pi/FrankenStatus/updater/your_private_key_file-privatekey.p12"
passphrase = "thepassphraseyouchose"
key = Google::APIClient::PKCS12.load_key(path_to_key_file, passphrase)

asserter = Google::APIClient::JWTAsserter.new(
   'yourgoogleserviceaccountemail@developer.gserviceaccount.com',
   'https://www.googleapis.com/auth/analytics.readonly',
   key)

api_client.authorization = asserter.authorize()
analytics = api_client.discovered_api('analytics','v3')
For this to work you need to apply for access to the beta of Google’s Real Time Reporting API. When you have access you can go ahead and create an application within the Google Cloud Console. You can create the application before you get access, but as soon as you try make the API call you will get a not authorised message. You will need to pass the application name into the function to create a new api client.
When you create the application in Google Cloud Console, go to the APIs & Auth section, select Registered apps and click through to the application you just created. There are 4 options for authentication – expand the Certificate option and click Generate New Key. This will generate a public key – download it and save it in the same directory as your grabStatus script – it will be named with a random number and a .p12 file extension. At the same time a random @developer.gserviceaccount.com email address will be generated, make a note of that: the next step in connecting to the Google API and authentication is to load the PKCS12 file, passing in the path to the key file you just downloaded and the passphrase you used.
You can then create an asserter by passing in the email address that was generated when you created the key, the authentication endpoint and the key object you created earlier when loading the key file.
You can then authorise and select the API that you want to use. At this point the analytics object in the ruby script is authenticated and has chosen to connect to the Analytics API.
You can then connect to the serial port:
port_str = "#{settings['serial_port']}"
baud_rate = 9600
data_bits = 8
stop_bits = 1
parity = SerialPort::NONE

sp = SerialPort.new(port_str, baud_rate, data_bits, stop_bits, parity)
Every time you make the serial connection it resets the Arduino board, so you’ll want to make the connection once at the beginning of the script and then hold the script open.
sleep(30)

db = SQLite3::Database.new "/home/pi/FrankenStatus/updater/updater.db"

loop do
Again, to make sure that all of the network connections have come up, wait a bit before kicking off the network connection, open the database and then begin the loop that will check for the settings.
response = NR_API.get do |req|
    req.url "/v2/applications/#{settings['new_relic']['mus_app']}.json"
    req.headers['X-Api-Key'] = "#{settings['new_relic']['api_key']}"
end
s = JSON.parse(response.body)

musHealth = s['application']['health_status']
musApdex = s['application']['application_summary']['apdex_score']
musApdex = (100 - (musApdex * 100)).round
The first thing to do with New Relic is grab the details of the application. Apdex is a range from 0 to 1, the higher the number the better. Since all of our data is based on percentage where the less usage is better, I invert the ApDex score and convert to a percentage.
The next thing to do is loop through each of the physical servers currently serving this application. Here I’m interested in their RAM and CPU usage, so for each of them I pop them into an array to work with later:
  mRam = []
  mCPU = []
  s['application']['links']['servers'].each do |server|
    response = NR_API.get do |req|
      req.url "/v2/servers/#{server}.json"
      req.headers['X-Api-Key'] = "#{settings['new_relic']['api_key']}"
    end
    t = JSON.parse(response.body)
    if t['server']['reporting'] == true
      mRam << t['server']['summary']['memory']
      mCPU << t['server']['summary']['cpu']
    end
  end
Now that all of the RAM and CPU values are in arrays, we can work out the average for each, as well as the maximum value for both RAM and CPU.
  musRamAve = (mRam.inject{ |sum, el| sum + el }.to_f / mRam.size).round
  musCPUAve = (mCPU.inject{ |sum, el| sum + el }.to_f / mCPU.size).round

  musRamMax = mRam.max.round
  musCPUMax = mCPU.max.round

  musStatus = [musRamMax, musCPUMax, musApdex].max
The last line is asking for the maximum value out of the maximum RAM, maximum CPU and ApDex. Later on when we start displaying the data physically we’ll use the maximum of all indicators for a specific application as the one we want to show (as this is the thing you want to be worried about).
We can then grab the number of concurrent users on the site from the Google Realtime Analytics API:
  profileID = 'yourGAsiteprofileID'

  result = api_client.execute(:api_method => analytics.data.realtime.get, :parameters => {
  'ids' => "ga:" + profileID,
  'metrics' => "ga:activeVisitors",
  })

  data = JSON.parse(result.data.to_json)

  kfmCurrent = data["rows"].first.first

  profileID = 'yourGAsiteprofileID'

  result = api_client.execute(:api_method => analytics.data.realtime.get, :parameters => {
  'ids' => "ga:" + profileID,
  'metrics' => "ga:activeVisitors",
  })

  data = JSON.parse(result.data.to_json)

  higCurrent = data["rows"].first.first
Our two music sites run off the same pool of servers, so the New Relic stats will be the same for both (same servers) but the GA stats will be unique to each site.
The next block of code is for our news site, and other than different New Relic application ID’s and GA site profile ID’s, the code should be identical to that from before:
  response = NR_API.get do |req|
    req.url "/v2/applications/#{settings['new_relic']['ewn_app']}.json"
    req.headers['X-Api-Key'] = "#{settings['new_relic']['api_key']}"
  end

  s = JSON.parse(response.body)

  ewnHealth = s['application']['health_status']
  ewnApdex = s['application']['application_summary']['apdex_score']
  ewnApdex = (100 - (ewnApdex * 100)).round

  eRam = []
  eCPU = []
  s['application']['links']['servers'].each do |server|
    response = NR_API.get do |req|
      req.url "/v2/servers/#{server}.json"
      req.headers['X-Api-Key'] = "#{settings['new_relic']['api_key']}"
    end
    t = JSON.parse(response.body)
    if t['server']['reporting'] == true
      eRam << t['server']['summary']['memory']
      eCPU << t['server']['summary']['cpu']
    end
  end

  # Get the average of each of the RAM and CPU for EWN
  ewnRamAve = (eRam.inject{ |sum, el| sum + el }.to_f / eRam.size).round
  ewnCPUAve = (eCPU.inject{ |sum, el| sum + el }.to_f / eCPU.size).round

  ewnRamMax = eRam.max.round
  ewnCPUMax = eCPU.max.round

  ewnStatus = [ewnRamMax, ewnCPUMax, ewnApdex].max


  profileID = 'yourGAsiteprofileIDhere'

  result = api_client.execute(:api_method => analytics.data.realtime.get, :parameters => {
  'ids' => "ga:" + profileID,
  'metrics' => "ga:activeVisitors",
  })

  data = JSON.parse(result.data.to_json)

  ewnCurrent = data["rows"].first.first
This next piece converts the number of concurrent users into a value in milliseconds. I wanted the millisecond value to be lower the more users were currently on the site. The value of 600 is a thumbsuck that should give a decent spread of millisecond values across the 3 sites. This piece is a bit of a time sensitive hack, and doesn’t include any error checking for when there are more than 600 concurrent users on the site (resulting in a negative millisecond value). This is proof of concept stuff, so it worked at that time
A better idea would be to retain a log of the maximum users seen on the site, and use that value in an Arduino map function to convert to the millisecond range.
  ewnCurrent = (600 - ewnCurrent.to_i)
  kfmCurrent = (600 - kfmCurrent.to_i)
  higCurrent = (600 - higCurrent.to_i)
All that’s left to do is construct the data string, store it in the DB and send to the Arduino:
  dataString = "#{ewnStatus},#{ewnCPUAve},#{ewnCPUMax},#{ewnRamAve},#{ewnRamMax},#{ewnApdex},#{ewnCurrent},#{musStatus},#{musCPUAve},#{musCPUMax},#{musRamAve},#{musRamMax},#{musApdex},#{kfmCurrent},#{musStatus},#{musCPUAve},#{musCPUMax},#{musRamAve},#{musRamMax},#{musApdex},#{higCurrent};"

  db.execute("INSERT INTO data (data) VALUES (?)", dataString.chomp(";"))

  sp.puts dataString
  puts "Waiting 2 minutes..."
  sleep(120)
end
sp.close
At this point you should have the latest values being pushed to the Arduino in 2 minute intervals, as well as a web interface to see what the actual data values are.